
AI is normalising n=1 experiments – and that’s a problem
Why your headline result may well just be a coin toss

“I developed a simulation model of a random process that’s highly dependent on input variables and I ran it once with no sensitivity analysis.”
If you’re thinking this isn’t a great approach, and certainly not good enough for decision-grade analysis, you’d be right.
And yet this is exactly what many papers and benchmarks do when it comes to large language models. People increasingly use LLMs to perform a coding task, or classify some data, and report the one-off result as if it’s a reliable and meaningful measurement.
A single run. No checking sensitivity to inputs. No reproducibility. No robustness. At best, the person reading the analysis can only hope they’ll get a similar output next time.
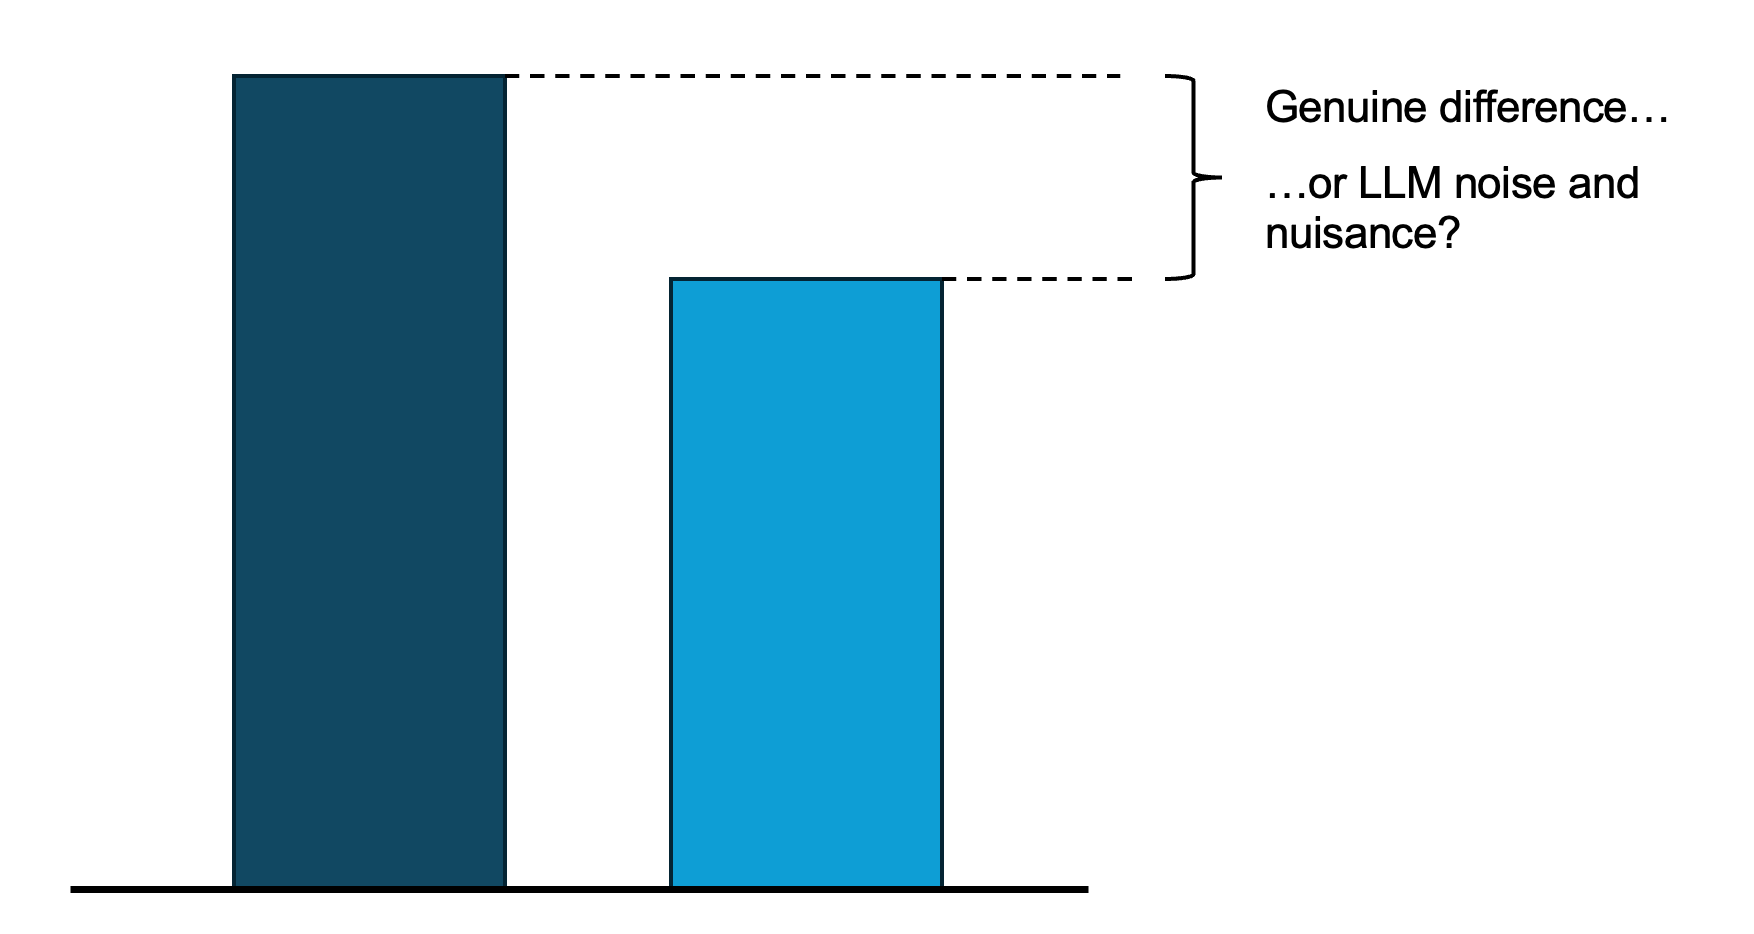
Even with a low temperature setting, LLMs can be extremely sensitive to data ordering and prompt structure. Suppose you use an LLM to analyse narrative reports from different regions. It concludes region A is overall 40% positive about an issue, and region B is 30% positive.
That might seem like a meaningful difference, but how confident would you be of getting the same numbers if the LLM was run again with some tweaks to the inputs? How much of that 10% difference is genuine - and how much is down to the quirks of a particular LLM run?
AI attitudes or AI noise?
Take a recent report from Anthropic, which surveyed 81,000 Claude users about AI perceptions. It’s been getting a lot of attention, and it does include some nicely visualised interactive comparisons, such as this one looking at sentiment across different regions:
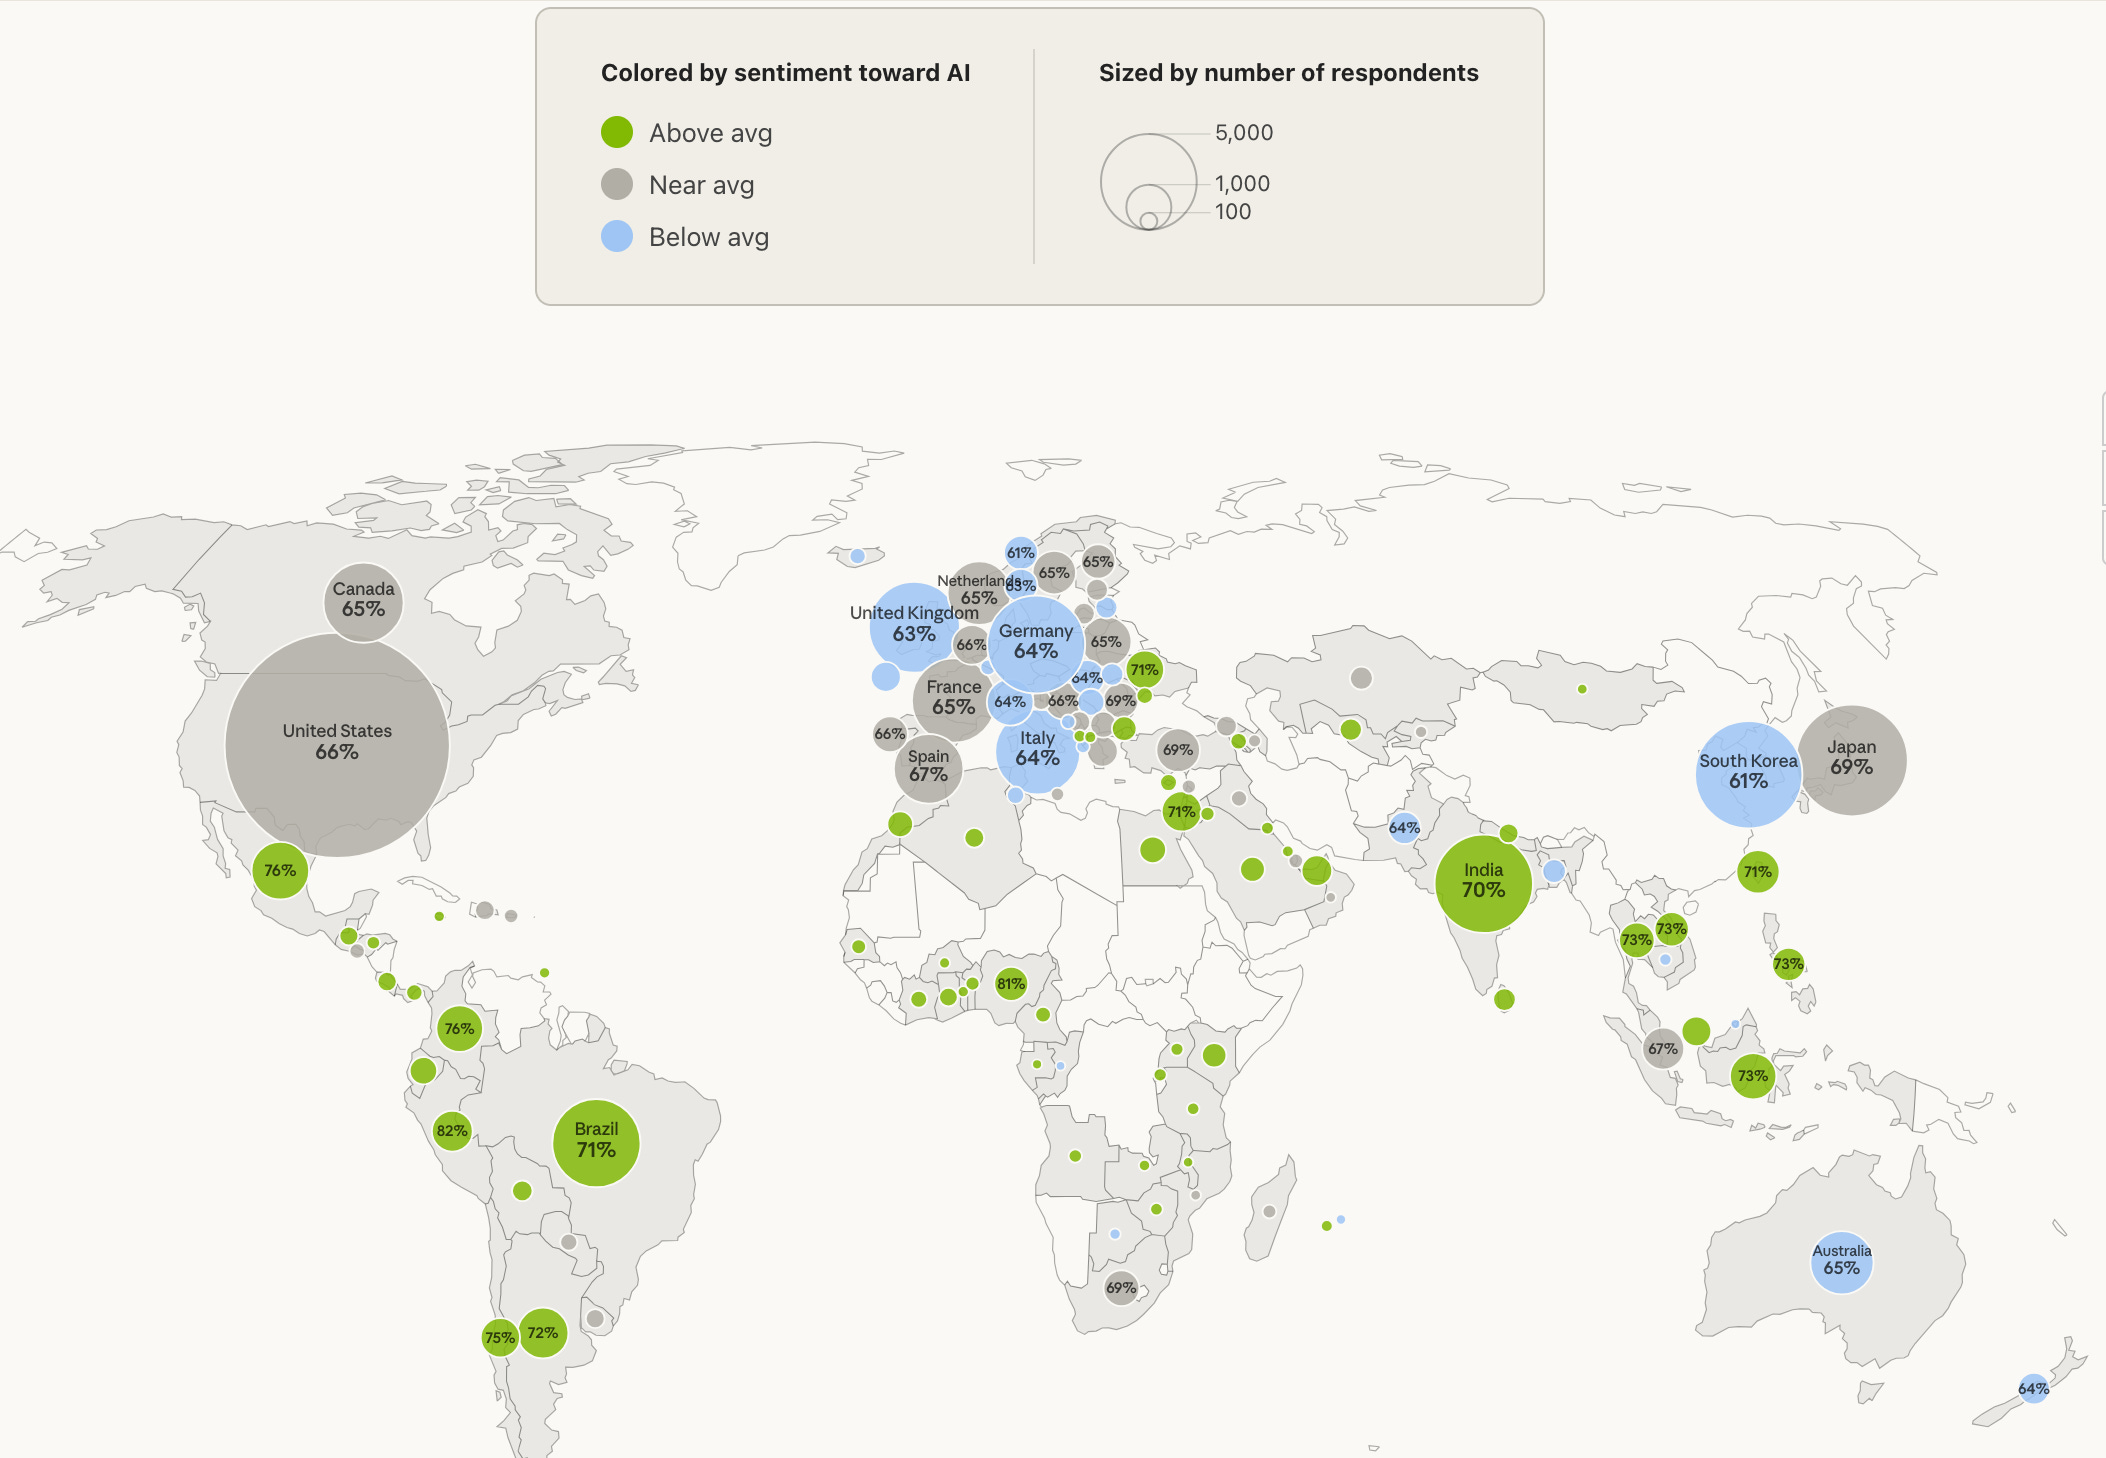
But how real are these differences? For example, are Brazilian users genuinely more positive about AI than UK ones?
It’s worth breaking down the different sorts of uncertainty lurking behind the headline numbers. Some of these are well-known, and some perhaps less so:
Sampling uncertainty: If around 3000 users are included from two countries, then each estimate comes with around ±2% margin of error (because more or less positive people may have been included by chance).
Representativeness uncertainty: More fundamentally, the sample consists of opt-in Claude users rather than a representative cross-section. The study looks at representativeness relative to user base (i.e. usage patterns, region, tier) rather than national populations. So if user composition differs between countries, differences may reflect who uses Claude rather than underlying attitudes.
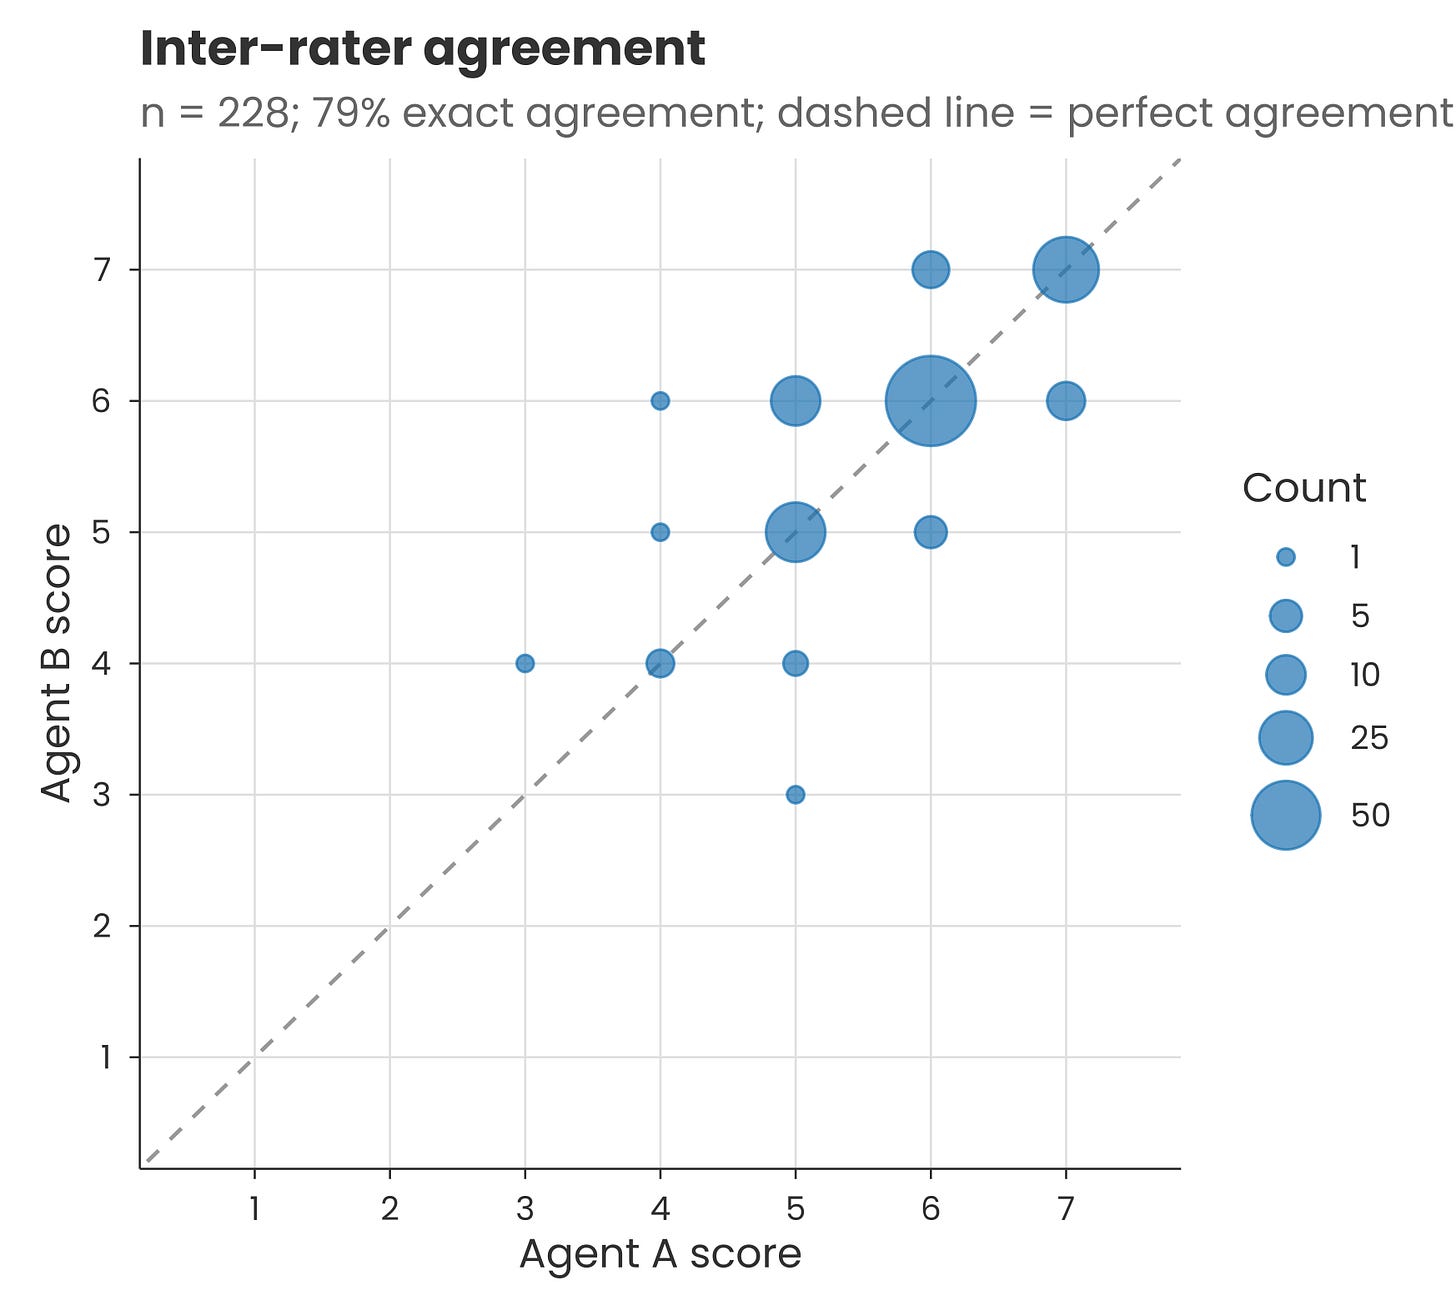
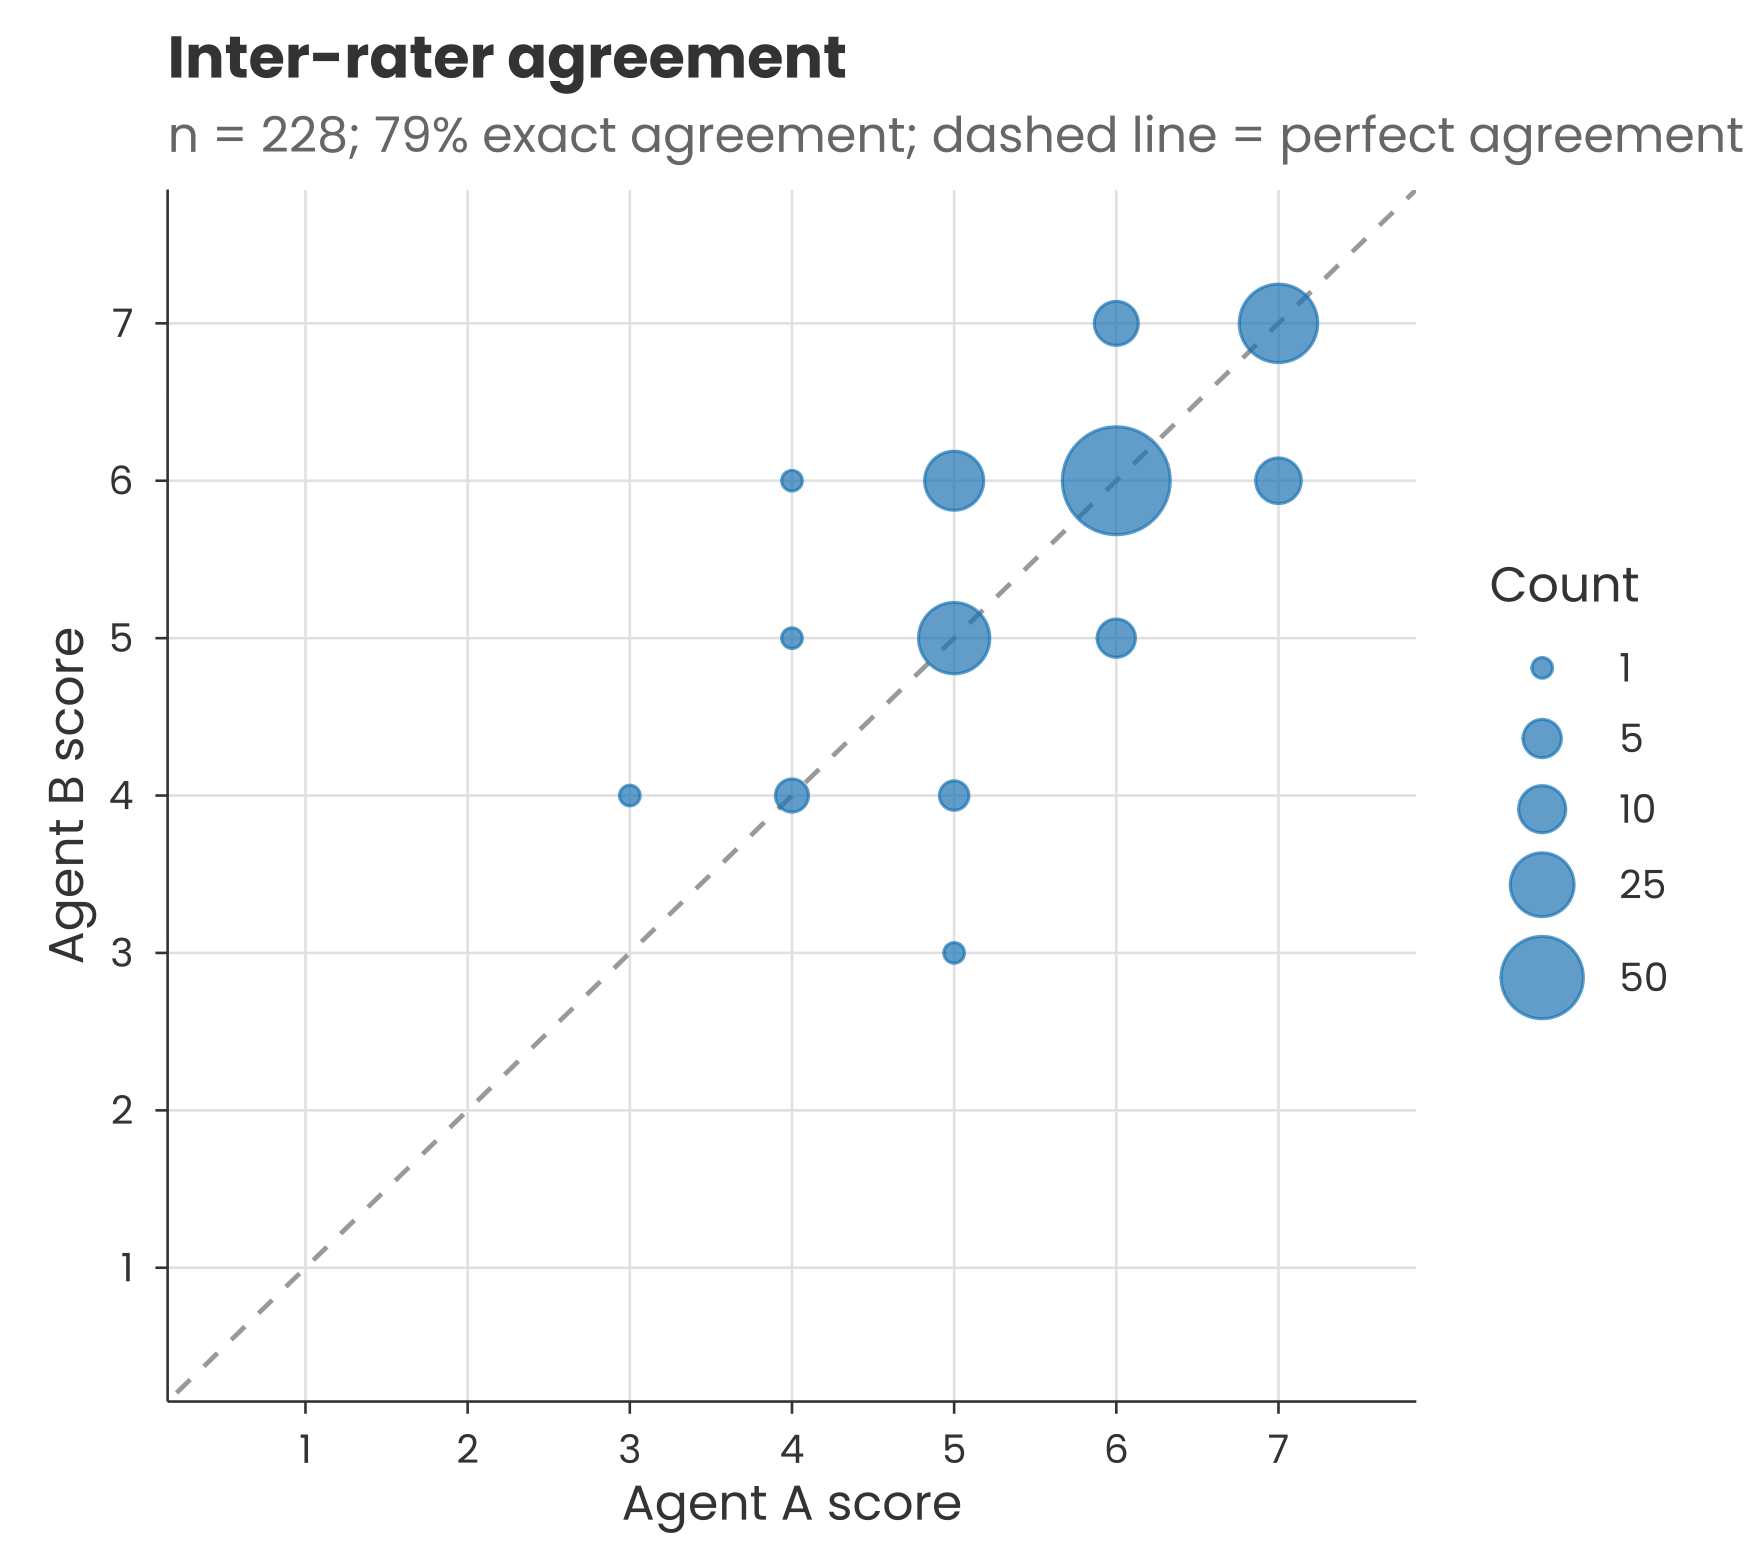
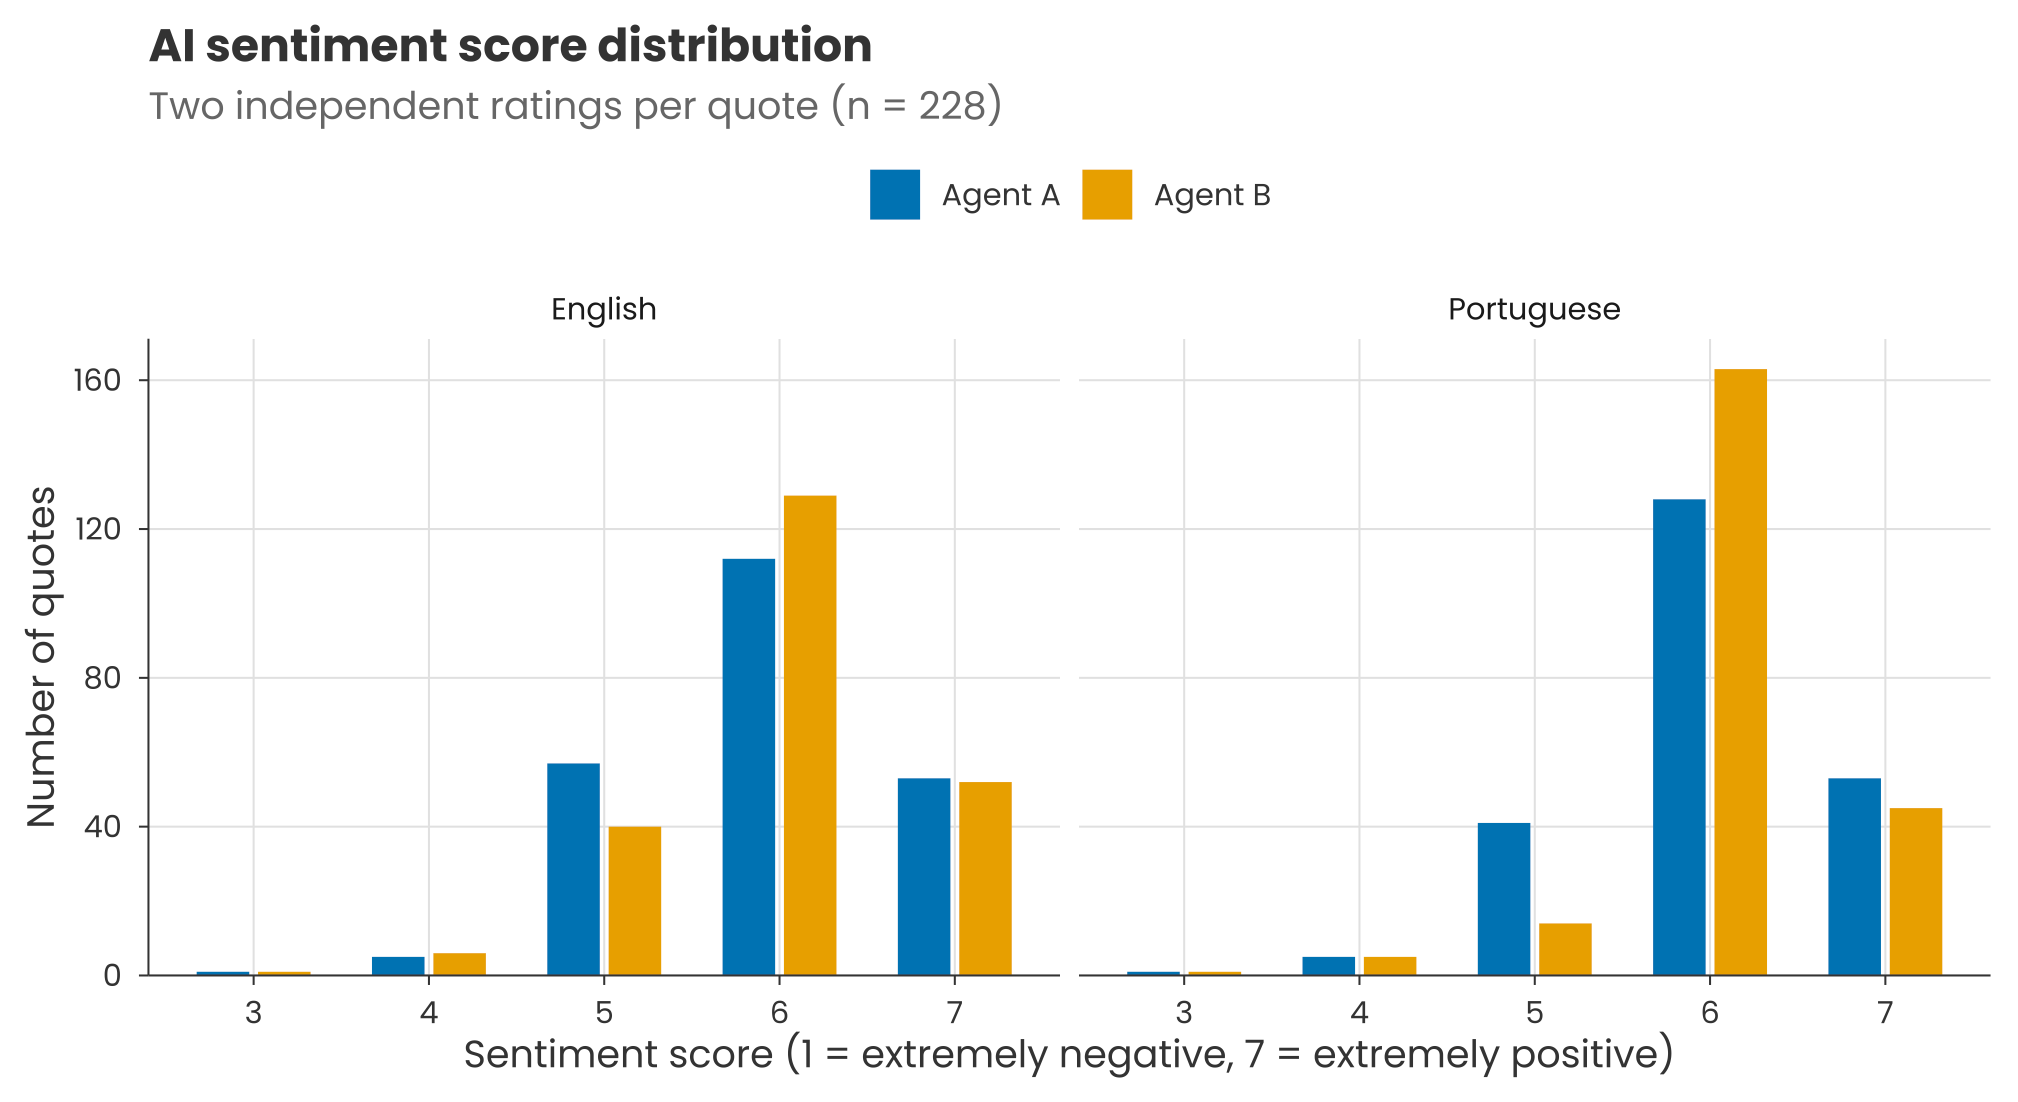
Measurement uncertainty: Claude won’t necessarily give an identical output each time. When I ran the sentiment classification prompt provided in the methods on a couple of hundred of the accompanying quotes, there was a 79% match between scores on two separate runs (i.e. two agents each running Claude Opus 4.6). The rest of the scores were slightly higher or lower the second time. This was just for short clear quotes, so the inconsistency may be different for full interview transcripts.
Definition uncertainty: Beyond measurement uncertainty, there’s also the issue of what exactly counts as “positive” sentiment. For example, I found Claude classifies this survey comment as being positive about AI: “I don’t want AI to do my work so I can wash dishes, I want AI to wash dishes so I can do intellectual work” – despite it paraphrasing an oft-cited AI criticism. Because transcripts were analysed one-by-one, the LLM has no consistent dataset-level frame of reference for ‘positive’ or ‘negative’.
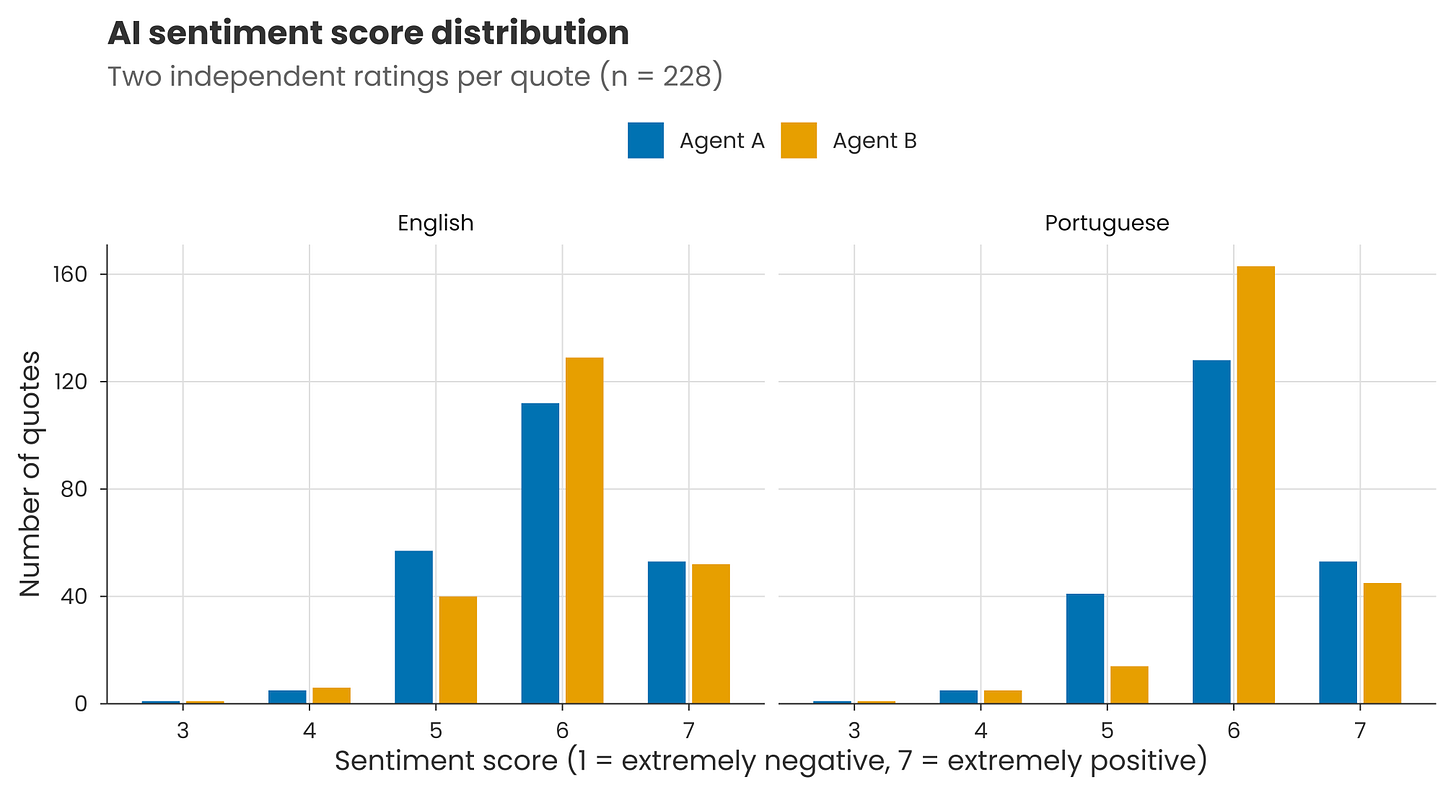
Translation uncertainty: LLMs can judge different languages in different ways. For example, when I translated those couple of hundred quotes into Portuguese and re-ran the classification prompt, the scores were more tightly centred around the mean. And re-running produced lower agreement than before, with a ~70% match for individual scores.
Binary uncertainty: The map above shows % of people with net positive sentiment (i.e. 5 or more out of 7 on the sentiment scale). But converting continuous scales to yes/no categorisations removes information. If one country has scores that cluster just above the threshold of 5 and another just below, they could have very different net positivity even though individual scores are similar.
It’s important to understand global perceptions of AI. But given the above, we should remember that headline numbers might not be as certain as they seem – and that there are well-established statistical tools out there to help us quantify this uncertainty.
As always, your clarity is fantastic - and scares me. We were already complacent about bias-reinforcing, over-simplified statistics and it will just get worse by the looks of it. Keep up the good work!
Okay, now I feel dumb. I had assumed that the presented output from these probability models would be related to the expected value over a reasonably large number of model runs.
Students would fail graduate courses for failing to do this in cost effectiveness modelling.
Is it too computationally expensive to do this?