
Schooled by randomness
Unpredictability can sometimes seem too predictable

Hungarian mathematician Tamás Varga used to run a mathematical experiment with school children. First, he would divide the class in two groups. He would give all the children in one group a coin, then ask them to flip it 200 times and write down the outcomes on a piece of paper. The other group did not get coins; they were told to jot down a list of 200 ‘random’ coin toss results instead.
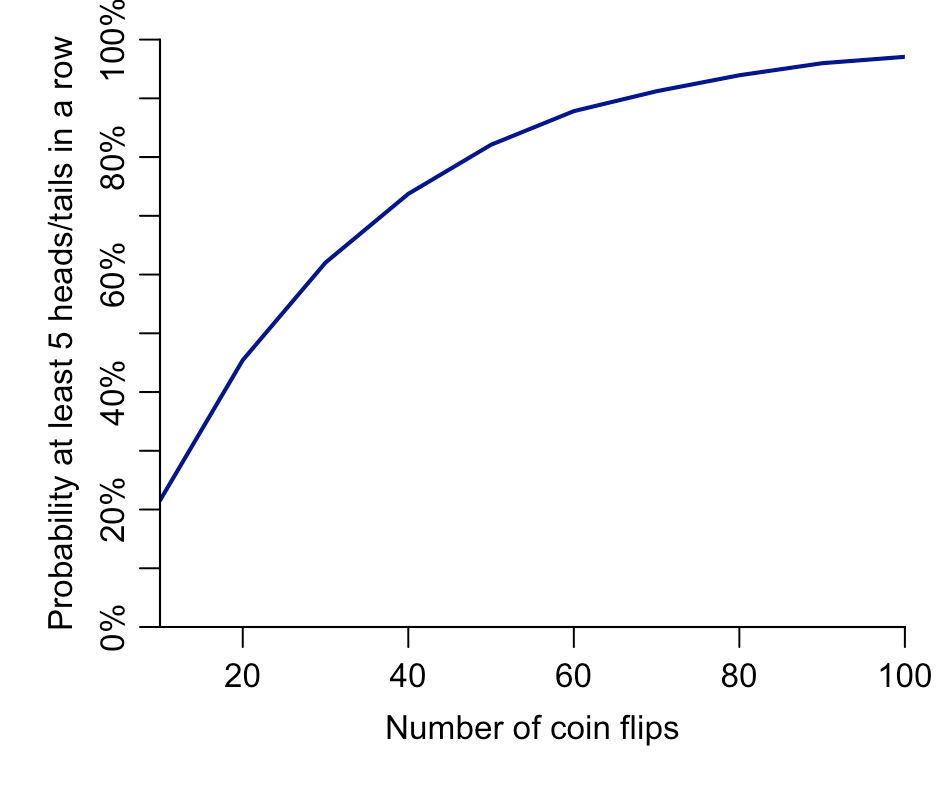
After gathering all the pieces of paper together, Varga said he was usually able to work out which sequence came from which group. The trick was to look for strings of the same result. For example, if you flip a coin 200 times, it’s extremely likely (around 99.9% probability) that you’ll get at least five heads or tails in a row at some point in the sequence. But Varga found that the children who had to invent results would rarely write down the same thing more than four times in a row. To spot the fictional results, Varga just had to look for the sequences that contained with no runs of more than four heads or tails.
From the classroom to the casino – and back again
Analysis of random sequences has been fundamental to the development of modern statistics. When Karl Pearson was refining his early methods for hypothesis testing in the summer of 1892, he needed random data to test them on. He turned to the Le Monaco newspaper, which published the results of casino roulette spins.
Studying sequences of repeat outcomes, Pearson found that strings of the same outcome (i.e. black or red) occurred far more often that we’d expect if a table was random. As he put it: ‘If Monte Carlo roulette had gone on since the beginning of geological time on this earth, we should not have expected such an occurrence as this fortnight’s play to have occurred once on the supposition that the game is one of chance.’
It wouldn’t be the first time someone had spotted a bias in roulette spins. In 1880, Joseph Jagger became ‘The Man Who Broke the Bank at Monte Carlo’ after betting big on a flawed wheel.
But Pearson’s finding wasn’t quite what it seemed. In The Perfect Bet, I recounted the story, and what happened next:
The discovery infuriated him. He’d hoped that roulette wheels would be a good source of random data and was angry that his giant casino-shaped laboratory was generating unreliable results. “The man of science may proudly predict the results of tossing halfpence,” he said, “but the Monte Carlo roulette confounds his theories and mocks at his laws.” With the roulette wheels clearly of little use to his research, Pearson suggested that the casinos be closed down and their assets donated to science. However, it later emerged that Pearson’s odd results weren’t really due to faulty wheels. Although Le Monaco paid reporters to watch the roulette tables and record the outcomes, the reporters had decided it was easier just to make up the numbers.
Finding fictional numbers
It’s not just journalists that can produce questionable data. There are many examples of researchers spotting unusual patterns in published academic studies, often because there is a signal of randomness. Specifically, randomness that is too well behaved.
For example, in 2014, a trio of researchers questioned the dataset from a published study of support for marriage equality, because it seemed to contain several oddities. In particular, the supposed follow-up data seemed remarkably close to what someone would get if they just simulated random values from a neat normal distribution. As the trio put it: ‘These irregularities include baseline outcome data that is statistically indistinguishable from a national survey and over-time changes that are unusually small and indistinguishable from perfectly normally distributed noise.’ Following these criticisms, the study was later retracted by the journal.
These examples all show the value of building some intuition about random processes. Perhaps by playing around with a simple simulation, whether with a computer or coin. Do our assumptions about randomness always play out?
It’s an important skill when working with science and statistics, because randomness doesn’t always look like we’d expect, while ‘perfect randomness’ is sometimes a signal that a dataset doesn’t quite match reality.