The COVID pandemic was often a story of what was unobserved. How many cases were being missed? Which variants had emerged undetected? What proportion of the population had been infected?
What if, instead of this ambiguity, we could have had a window onto undetected global COVID dynamics? In the UK, the ONS and REACT community surveys, which tested people regardless of symptoms, provided such insights. Could this have been achieved elsewhere?

The problem with big community studies is they’re expensive and logically challenging. If intensive testing was conducted globally, it was typically in smaller studies with specific groups of people, such as healthcare workers, small communities or sports teams. Such studies are useful for understanding certain features of the epidemic, like circulating variants and individual infectiousness, but they don’t tell us so much about the overall level of infection in the population – or about patterns in other countries. However, there’s a big alternative data stream that has been under-analysed during the pandemic: traveller testing.
Traveller testing provided a lot of key early information on COVID, from fatality risk to undetected outbreaks. Unfortunately, it’s been harder to reconstruct epidemics over time using these data. In theory, if a country tests all incoming travellers - as many did during the pandemic - we can piece together infection levels in departing countries (at least among populations who might travel). But there are two main problems.
If there is departure testing in place too, and a positive test means no travel, the people arriving won’t be a representative sample of infection prevalence at point of departure. Because departure and arrival testing data are rarely linked, the raw arrival testing results will give us a biased estimate of who would have tested positive at departure.
Travel testing was often not systematic, with different airports, companies, and testing protocols involved. Which makes it tricky to compare trends over time. Take the below report during the 2021 Delta wave – how should we interpret such a data point?
Fortunately, we can tackle first problem by building a model of the testing protocol and using estimates of test positivity to reconstruct prevalence at departure. Like many epidemiological questions, if we understand something about the underlying process, we can estimate some of the unobserved values.
To address the second problem, we worked with our amazing colleagues at Institut Louis Malardé in French Polynesia to analyse over 220,000 samples collected during their arrival testing programme between July 2020 and March 2022.
The data collection in French Polynesia – which involved self-testing after arrival – is especially remarkable when you consider the spatial area that the country covers; it’s similar to Western Europe in size.

The majority of arrivals in French Polynesia had either US and France as their country of origin. Using arrival data and our reconstruction method to adjust for testing protocols, we could therefore estimate infection levels at departure in the two countries (blue lines below show smoothed trend):

We estimated that infection prevalence at departure peaked at 2.1% (95% credible interval: 1.7–2.6%) in France and 1% (0.63–1.4%) in the USA in late 2020/early 2021. During the Omicron BA.1 waves in early 2022, we estimated prevalence peaked at 4.6% (3.9–5.2%) in France and 4.3% (3.6–5%) in the USA. For context, PCR test positivity in the ONS community infection survey in the UK peaked at around 2% during the Alpha wave in early 2021 and around 7% during the BA.1 wave in late 2021/early 2022.
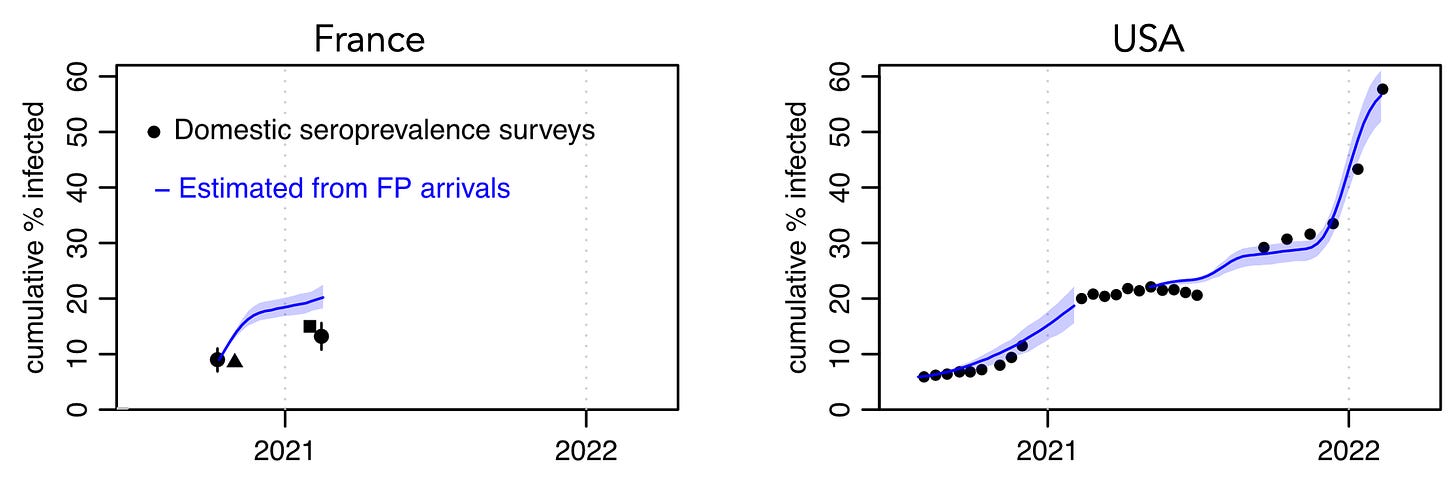
As well as being a leading indicator of subsequent case patterns, our estimates of cumulative infections in France and US derived from the traveller data (blue lines) reflected observed changes in antibody levels over time (black points):
Our findings were recently published in PLOS Medicine, and the paper describes the methods and caveats in more detail. But if this is what we can do with data from one country with a relatively small number of arrivals each week, imagine what insights we could have had into the pandemic if we’d been able to synthesise prevalence estimates across multiple countries and datasets. Especially if estimates had been reported from highly connected travel hubs in different continents.
Such analysis could have generated ONS/REACT-like estimates for global infection dynamics of COVID during 2020-22, all using data that in many instances was being collected anyway. This would have given us vastly improved situational awareness, a better understanding of variant emergence and infection burden, and more data with which to evaluate travel control measures.
We therefore hope our proof-of-concept helps show what could have been for COVID – and what could be possible for future pandemics.


Adam, this is quite an interesting and a novel use of data.
Thank you for exploring this.
Very interesting and educational. A wise tone prompting understanding the virus and valuing public health data was sadly not set by UK governments. Instead people tended to see travel related testing as restrictive without benefit or a source to blame incomers!