How many people are currently infected with SARS-CoV-2 in the UK?
From April 2020 to March 2023, one of the best answers to this question was provided by the ONS Coronavius Infection Survey. In each survey round, a random selection of people were tested by PCR, which made it possible to estimate how many in total in the UK would have tested positive in a given week. The below plot shows these estimates over time during the Omicron variant waves in late 2021-22:

Recently, a new version of the survey has launched, this time using rapid antigen tests (aka lateral flow tests), which are easier and cheaper to carry out than PCR. Early results from late November 2023 estimated that around 1.2% of participants tested positive.
Before you look up to compare with the above graph, it’s not quite that simple. The probability of detecting virus at a given point post-infection is lower for rapid tests than for PCR. Subsequent analysis has therefore adjusted for this difference, to estimate how many people would currently test positive by PCR. Here’s what the adjusted 2023 estimates look like (with more details in this thread by Jonathon Mellor):
Yet this still doesn’t really answer our original question. It tells us what percentage would have recently tested positive by PCR, which is a useful proxy for people who have virus in their system – but that’s not quite the same thing.
So, how many are currently infected with SARS-CoV-2?
And is this even a sensible question to ask?
Diagnosing infection
Historically, identification of infection has typically been triggered by an event. Perhaps someone has developed symptoms, or has come into contact with a known infected case. In both instances, the test comes with the benefit of prior information. We know when the person may have been infected (based on the incubation period, or the timing of exposure to another case) and we know whether they have symptoms or a recent exposure that poses a transmission risk.
This means we can define the ability of a test to correctly spot a true infection (i.e. the ‘sensitivity’ of a test) relative to the wider group of individuals in the same situation. For example, of those patients with symptoms and virus in their system, how many infections will the test correctly detect?
Things are less straightforward when we test randomly in a population, because there was no trigger event (e.g. a symptom onset or exposure to a case). Whereas recently symptomatic people and recently exposed people are likely to be early in their infection, randomly tested people could be at any point in their infection. If we’re talking about the ‘sensitivity’ of a test, we therefore need to define what a ‘true’ infection is.
Sensitivity for COVID testing is traditionally defined in terms of a PCR test. So when people talk about the ‘sensitivity’ of a rapid test, they usually mean how it compares to a PCR test. This might be useful for symptomatic diagnosis, but as noted by many public health researchers, the comparison is less useful if we’re interested in individual infectiousness. If a ‘true positive’ is someone who is infectious, rapid tests will detect a larger proportion of this group than the proportion they would detect if ‘true positive’ is defined as PCR-positive.
The comparison with PCR is also of limited use if we’re interested in population levels of infection, because it means we have to talk about COVID dynamics in terms of ‘people who would test positive by PCR’ rather than actual infection events.
So, can we do better?
Delays, delays, delays
Let’s start at the beginning: the moment of infection. In reality, we rarely observe this event (at least, outside human challenge studies). Instead, we observe the measurable – but noisy – effects of this event, whether in terms of viral shedding that may be picked up by a later PCR or rapid test, or immunological responses that may be picked up by later antibody tests.
In other words, we have an estimation problem. Anything we measure is the delayed effect of an earlier infection, so we have to use these delayed values to try and estimate the original infection patterns.
To illustrate these delays, here is our published estimate of the probability of testing positive by PCR over time since infection:
We can use this curve to calculate the probability an infected person was infected a given number of days ago, given they’ve tested positive:
So if someone tests positive by PCR, it’s most likely they are a few days post infection. It’s much less likely that they were infected in the past day or so, or more than a couple of weeks ago.
From diagnostics to dynamics
A common myth during 2020 – particularly as infection levels rose in the second wave - was that the COVID pandemic was an illusion, merely a ‘casedemic’ driven by ‘false positives’. However, the idea that large numbers of PCR or lateral tests were returning positives among those with no virus - or fragments of very old virus - in their system was easily debunked. As I pointed out at the time, mass PCR testing in Wuhan during May 2020 had identified 300 asymptomatic positives out of 9.9m tested. Even if we assumed all of these were false results, it gave an upper bound of 0.003% for the percentage of false positives. A subsequent mass testing drive in Hong Kong would find similar results. And Oliver Johnson would later use data from Orkney and Shetland to make a similar argument about the reliability of rapid tests.
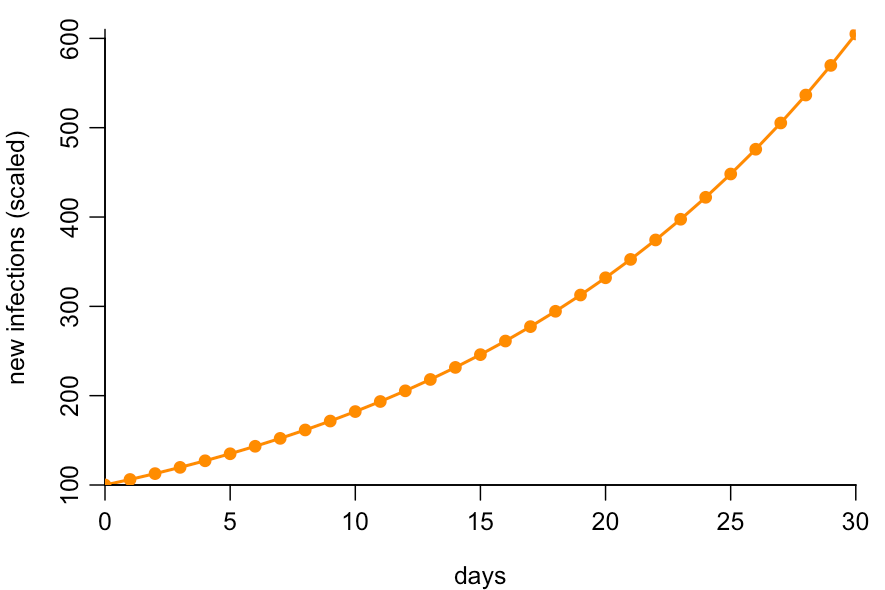
Much of the confusion about false positives could have been avoided if more public discussion had focused on the dynamics of the underlying epidemic – which is ultimately what we care about. Suppose infections are growing at around 6% per day, which they were during October 2020. If we plot new infections over time (normalised to begin at 100), we’ll therefore get the following pattern:
Because the epidemic is growing, most infections will be recent, so for a randomly selected infected person, it’s exponentially less likely that they were infected further in the past. Chances are they were infected recently:
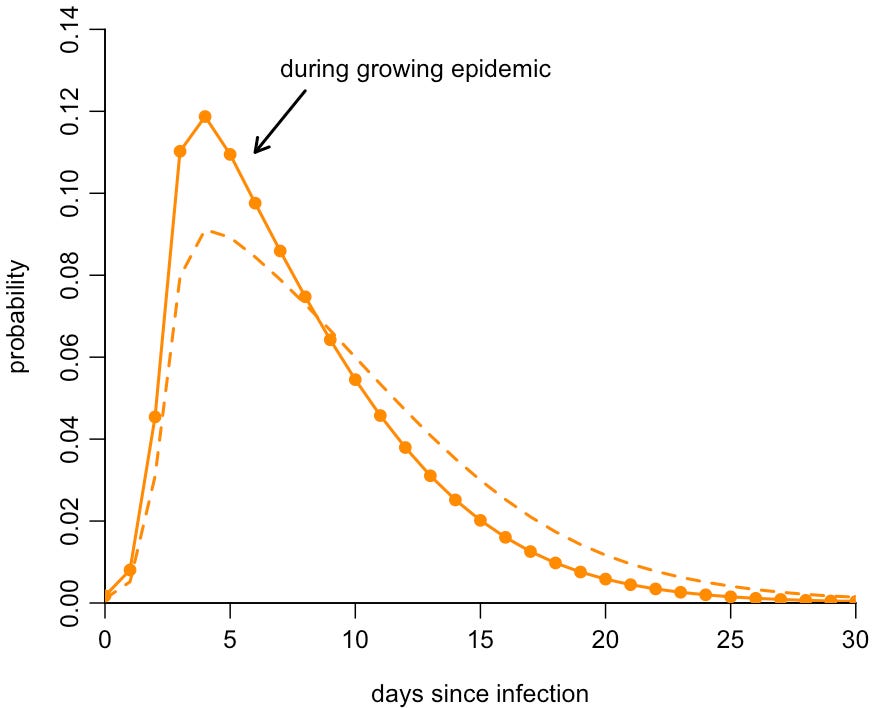
We can therefore adjust the PCR positivity curve we saw earlier to account for this skew in probability. The result is that, in a growing epidemic, it’s very likely that someone who tests positive by PCR is earlier in their infection, and hence likely to be shedding infectious virus rather than old fragments of RNA. Here is the original PCR detection curve (shown by dashed line, which implicitly assumes a flat level of infection) compared to the adjusted curve for an epidemic growing 6% per day (shown by solid line):
If a random person tests positive by PCR in a growing COVID epidemic, the above suggests there’s a 90% chance they were infected in the past two weeks. (And if they tested positive with symptoms, this probability will be even higher, because the onset of symptoms will have shifted the timing of the test earlier relative to a randomly selected person.)
Multiple epidemics, same percent positive
We’ve seen that the probability of testing positive depends on the time since infection, and the distribution of times since infection varies depending on the epidemic dynamics. Hence the percentage of randomly selected people who test positive by PCR will mean different things epidemiologically during a rising and falling epidemic.
As a result, very different epidemic dynamics could all lead the same percentage of people testing positive. For example, the below curves show three hypothetical scenarios for new daily infections over time (shown in terms of the percentage of the population getting newly infected that day). If we tested a group of people randomly with a PCR test on day 30, we’d expect around 5% to test positive by PCR in all three scenarios.
Would you be happy to conclude that the number of people ‘currently infected’ on day 30 is the same for all three curves above?
What is a ‘current infection’ anyway?
Thinking about the dynamics of an epidemic can help with our original question: how many people are currently infected with SARS-CoV-2? Because we can only measured delayed outcomes of infection events – like PCR or rapid test positivity – it will always be hard to say meaningfully how many people are ‘currently infected’.
Instead, I’d argue it’s better to ask how many people were infected on a given day, because these are unambiguous events, which we can then try to estimate from available test data. What’s more, it means that if we have access to both PCR and rapid testing data, we can estimate new infections over time by combining both of these datasets using our knowledge of positivity over time, rather than just debating what ‘sensitivity’ means. And it also means we can handle additional complexities, such as repeat testing among travellers (as I wrote about previously), and still obtain meaningful estimates of epidemic dynamics.
(R code to generate the above plots is available here. For a more detailed technical discussion of this topic, I’d recommend looking at these papers on interpretation of viral shedding data and ONS positivity.)


