Recent reports of a surge in childhood infections in China have sparked discussions about potential explanations. It seems the apparent surge is (thankfully) not down to a novel pathogen, and is instead the result of familiar seasonal viruses and bacteria. So could a prolonged suppression of seasonal infections now be leading to a period of unusual outbreak dynamics?
I’ve previously written about the combination of immunological and epidemiological factors that keep ‘winter viruses’ constrained to winter. But what about other infections that have previously had an element of predictability in their dynamics? How might a period of low infection levels affect what happens next?
Clockwork epidemics
Let’s start with a virus that is anything but a winter infection. In recent decades, dengue virus types have repeatedly swept through the Pacific islands in the same order. It’s been like clockwork: dengue-2, then dengue-1, then dengue-4, then dengue-3, then 2, 1, 4, 3…

As you might have guessed, in the late 2010s, dengue-2 once again emerged to cause epidemics across the region.
This predictable sequence of outbreaks comes from a combination of outbreak-linked immunity and newborn-linked susceptibility. Suppose we have a new infection – as dengue once was – where everyone is susceptible. If the epidemic sweeps through, then the ‘herd immunity’ threshold (i.e. the point at which there is enough immunity to tip the epidemic into decline) will be reached at the peak of the epidemic. However, the epidemic won’t suddenly stop at that point. It will keep going, infecting more people as it declines, before eventually coming to an end.
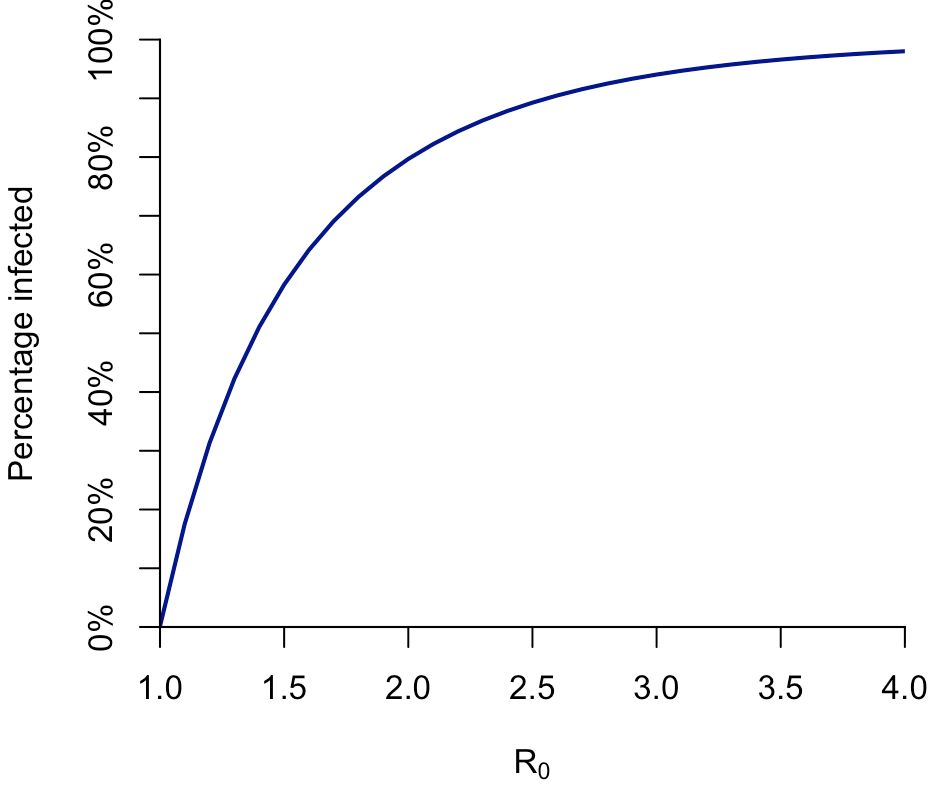
The more transmissible the infection, the more people get infected. If we use a simple SIR model to simulate this epidemic dynamic, we get the following relationship between the percentage of the population infected and R0 (i.e. the average number of people that a typical infectious person passes the pathogen onto, assuming everyone is susceptible):
But if we look at the percentage of the population that needs to be immune to tip the epidemic into decline – the ‘herd immunity threshold’ – we get a shallower curve. Which isn’t that surprising, because the peak occurs before the end of the epidemic. (And which also means, that the same overall effect would occur, albeit with different values, if we used a more complex model for a large epidemic.)
Here’s a comparison of the herd immunity threshold (solid line) and the percentage infected from the plot above (dashed line):
The difference between the herd immunity threshold and the overall proportion infected is known as ‘overshoot’: the simulated epidemic generates more immunity than is required for it to peak and decline.
We can see the extent of overshoot more clearly if we plot the difference between the epidemic size and herd immunity threshold. We can also think of this as the amount of additional susceptibility that would be required for another epidemic to be possible:
So if R0 is around 2, then – in this model, at least – an additional 30% of the population needs to become susceptible before there can be another epidemic.
New susceptibility
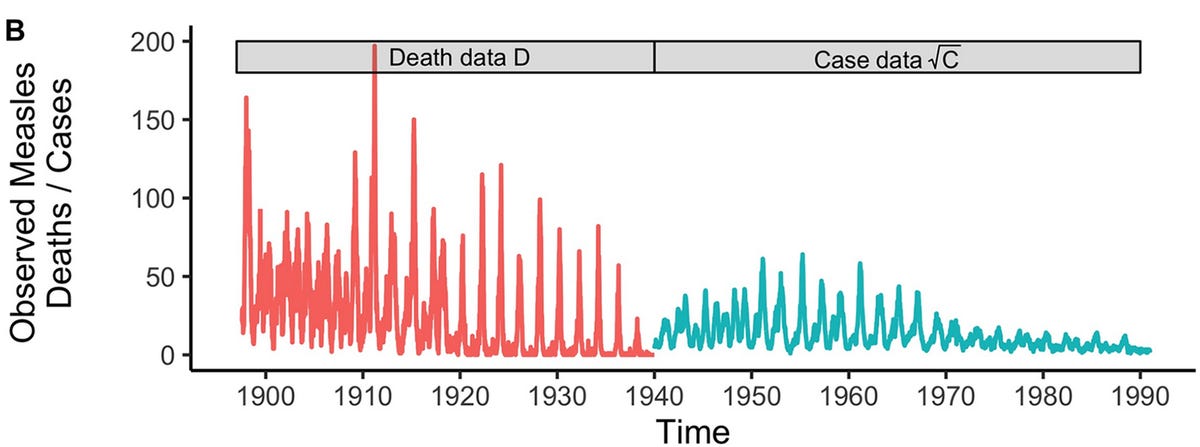
Where does that susceptibility come from? For many infections, the answer is population turnover: over time, births will increase the proportion of the population susceptible. This is why many endemic infections are diseases of childhood. For example, in populations that don’t vaccinate again chickenpox, outbreaks occur among younger susceptible groups, who (in the case of infection with the chickenpox virus VZV) then develop some immunity. Measles (before vaccination was introduced) was highly contagious, and hence required fewer new susceptibles to cause outbreaks, so it came back every year or two:

Typically there are also some seasonal effects at play – like school term times – that help keep these epidemics in a recurrent dynamic, rather than settling down to a consistent level.
Dengue is less transmissible than measures and chickenpox, so the timescale of epidemics is typically slower. But the overall principle is the same: an epidemic generates immunity to a specific type, then population turnover reduces it proportionally. (Note: this doesn’t mean epidemics or infections are a good thing; immunity just explains the patterns we see.)
So if we have a period where infection levels have been much lower (e.g. because of COVID restrictions) then it means that an epidemic that might have started when there was a modest level of susceptibility will instead begin after more births have occurred – and hence into a population with a higher proportion of individuals susceptible.
However, this is likely to only be a temporary effect for many pathogens. If a post-COVID seasonal epidemic is larger because of increased numbers of new susceptibles, it will lead to more infections and hence – based on the logic above – subsequent waves may be smaller, until the infection eventually settles back down into its (somewhat) familiar pattern*.
*Unless the infection is influenza B/Yamagata, which was apparently driven to extinction during the COVID pandemic.


Nice clear description and analysis. Great work on the measles outbreaks even though I struggle with the maths. Nice to see the work of May and Anderson included.
Very nice and clear Adam. Thanks.