
Radar riddles
How a neat statistical method helped the Allies quantify what they were facing in the Second World War

During 1941, a growing network of Nazi radar stations across Europe was making it increasingly difficult for the RAF to run successful missions. Planes were getting intercepted faster and more frequently. Which raised the question: how many radars were out there?
Eventually, British intelligence discovered the serial numbers of four Nazi ‘Freya’ radar stations. These acted as an early warning system before short-range Würzburg radar took over to track the RAF planes more precisely.
The Freya serial numbers the British discovered were as follows: 22, 59, 82, 132.
Could they use this information to estimate how many radars there were?
I recently came across this story in Tom Whipple’s excellent book Battle of the Beams. While I was reading, it occurred to me that it was a version of a mathematical puzzle I was already familiar with. It’s commonly known as the ‘German tank problem’, and it shows how we can sometimes extract a lot of valuable information from relatively little data.
So, how does it work?
Serial insights
From 1943 onwards, the Allies would systematically analyse serial numbers from captured German equipment – such as tank tires1 – to try and estimate how many their enemies were manufacturing. Hence, the German tank problem. But how is it possible to turn a scattering of serial numbers into a useful estimate?
As a simple example, suppose we capture two tank tires and they have serial numbers 500 and 700. What should be our best guess of how many tank tires have been manufactured?
First, let’s assume that the tire serial numbers we have are randomly sampled from all the possible serial numbers out there (which is a reasonable starting assumption if we have no reason to believe otherwise)2. If tire serial numbers are random and the largest one we’ve found is 700, it implies that at least 700 tires must have been manufactured.
Let’s say that N have been manufactured in total, and we want to work out N (which is some number that must be at least 700). It might help to think about the two serial numbers as if they’re randomly selected points on a number line between 0 and this unknown value N:

If we were to place two random points on a line like the above, then we are effectively splitting the number line into three pieces.
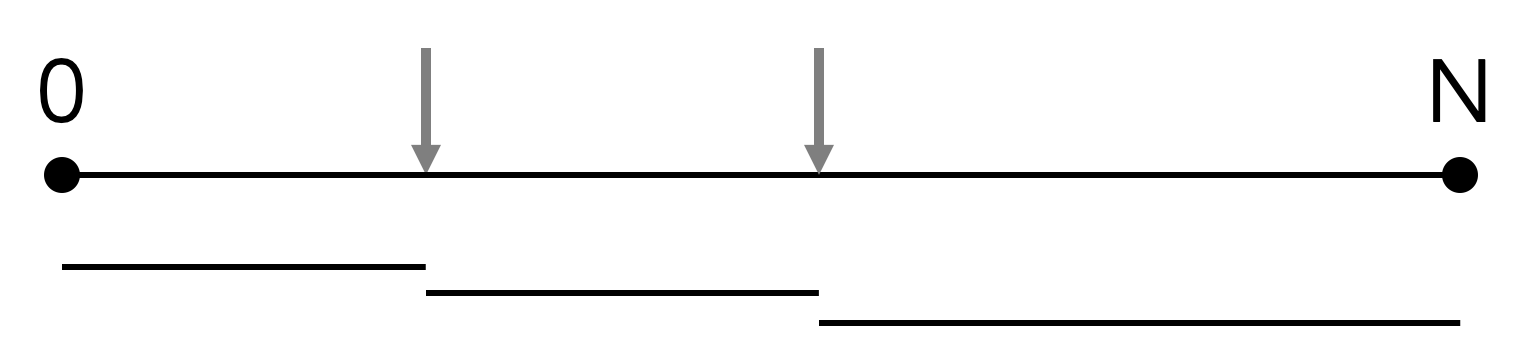
And if we were to do this repeatedly, picking two random points and measuring the lengths of the three pieces, we’d expect the average length of each piece to be 1/3 of the overall length of the line (i.e. N).
Hence we’d expect the point with the largest value to lie around 2/3 of the way along the line on average:

If you want a quick proof of this, open Excel and enter the following formula into a cell to calculate the maximum of two random numbers:
=MAX(RAND(), RAND())
Then copy the formula down a few thousand rows to simulate a large number of random points. Finally, calculate the average of all the values in the column, which will be around 0.66.
If we have two tire serial numbers and the largest is 700, the above logic gives us the following expected relationship between this largest value and the total number of tires N:
The N+1 here is to account for the fact that 0 isn’t likely to be a valid serial number (i.e. in reality the line would start from 1). If we rearrange this equation, it gives us a best guess for the total number of tires:
What about a bigger sample size?
We can use the same logic if we have a larger number k of serial numbers (in the above example, k = 2). This logic gives the following relationship between the length of the line (i.e. N), the number of random serial numbers (k) and the expected value of the largest point (i.e. the maximum serial number we’ve found):
Hence we can rearrange this formula to calculate N:
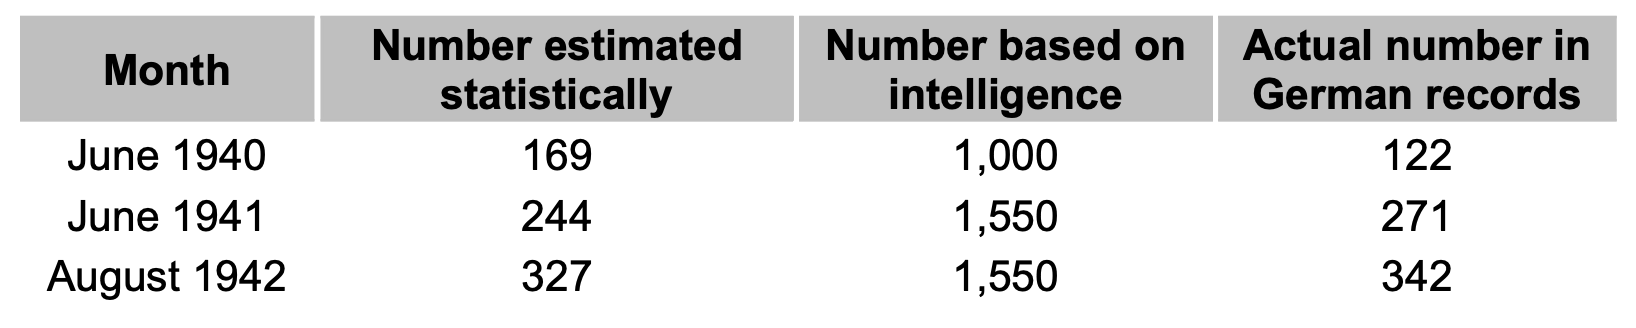
When Allied analysts used this approach to estimate total tank production, they ended up with numbers that were much closer to the true value (based on German records captured after the war) than the joint estimates of US and British intelligence:
Which brings us back to the Freya radars. Given those four serial numbers (22, 59, 82, 132), which had a largest value of 132, the best estimate for the total number of Freyas comes out as 132 x 5/4 – 1 = 164.
As it happened, RV Jones, who was leading the radar analysis in 1941, suggested that the best estimate for the total ‘should be of the order of 150’. Perhaps at this point in the war, the method above wasn’t fully known within Allied intelligence – or Jones deemed it too complicated to include in his write-up – but he still reported the right ballpark.
And from those four numbers, and a bit of mathematical thinking, the Allies suddenly had a much better idea of the scale of the problem they were facing.
If you want to know more about the ‘German tank problem’ and its origins – alongside lots of other stories and far less algebra – you might be interested in my upcoming book Proof: The Uncertain Science of Certainty, which is out this week in the UK and available to pre-order now.
Specifically, the analysis referred to the rubber rims mounted on the wheels of a tank's suspension system as ‘tires’
RV Jones, who led the radar analysis, also made this assumption: ‘We can only assume that these were selected at random from the total number of Freyas in existence’
Cover image credit: The US National Archives and Records Administration - Foto 111-SC 269043
Adam, from what you have written, the method was clearly successful. However, when I set up my word processing business in 1985, I was keen to give the impression that the business had been trading for some time, so I started the invoice numbering at QN1001.
According to the likelihhod principle, the best estimate is the maximum of the observed values.