Three things we learned from 180,000 Premier League PCR tests
How to convert COVID control measures into scientific insights, from infection dynamics to immunity
During the pandemic, my colleagues and I collaborated on analysis of several routine COVID testing programmes, from healthcare workers to international travellers.
We’ve just had a new paper published, focusing on another situation where individuals in a well-defined population were routinely tested: the English Premier League testing programme. Like most other activities, football fixtures were suspended in mid-March 2020. Then, in May 2020, a plan for a biosecure bubble – similar to the one the NBA would later use – was developed to help games resume. This involved twice weekly testing of core players and staff. At first, this was done with PCR tests, but between June and November 2021, and from January 2022 onwards, rapid lateral flow tests were used for screening, with confirmation by PCR testing if the rapid test returned a positive result. (Regular PCR testing was re-implemented during the early stages of the Omicron wave in December 2021.)
In total, this meant there were almost 180,000 PCR tests from over 7,500 unique individuals available to analyse, alongside over 100,000 rapid tests.
So, what did we find?
1. Infection prevalence tracked levels in the community
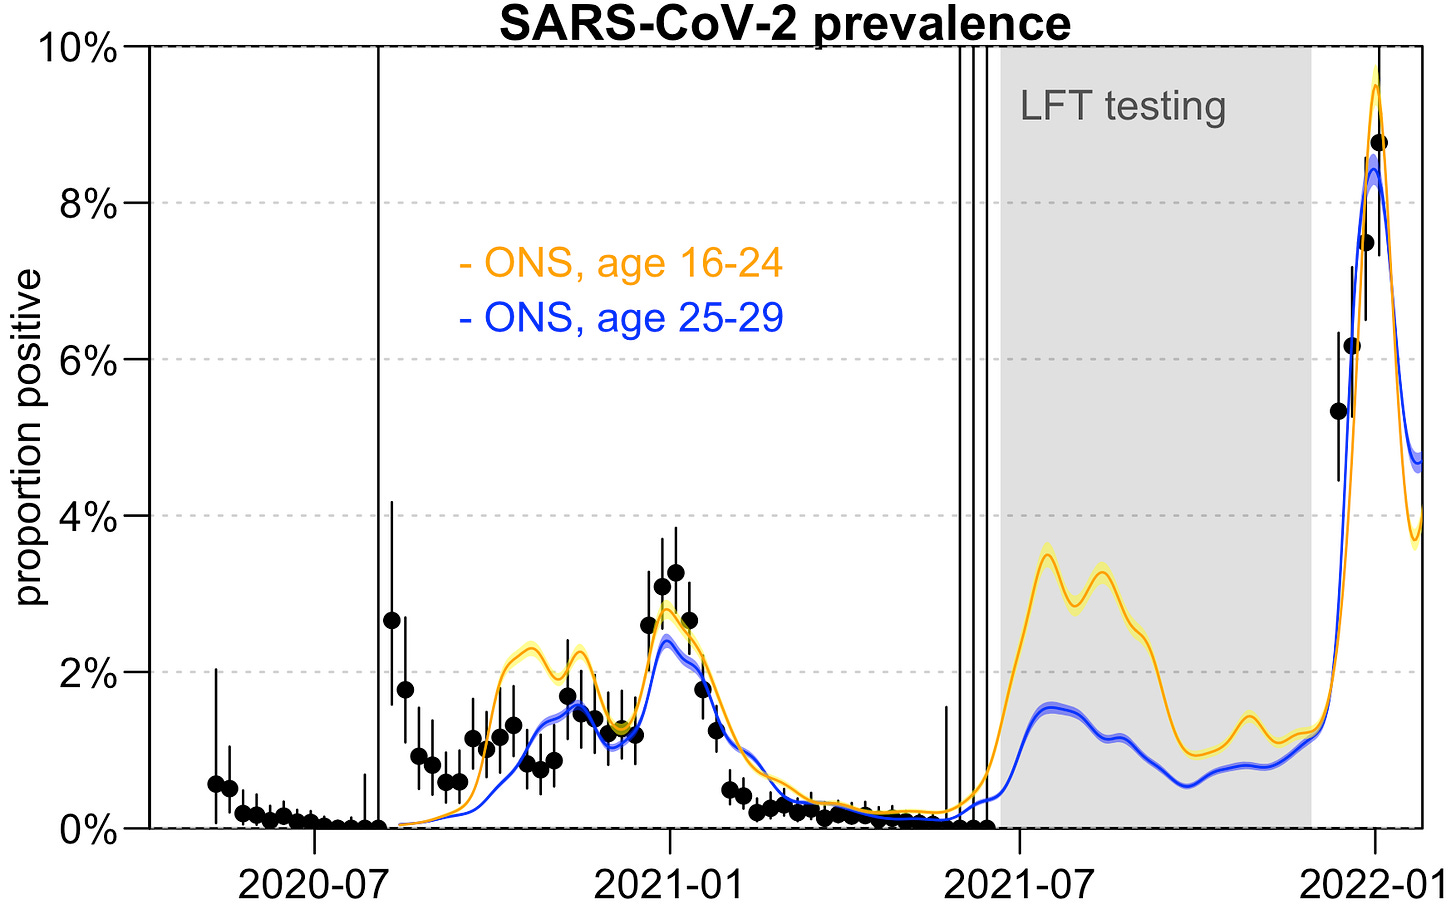
One of the striking things we noticed when we first plotted the proportion of individuals testing positive over time in the Premier League was how closely it mirrored patterns in the ONS Community Infection Survey, which tested random individuals in the wider population:

With the exception of early outbreaks in August 2020, and spring 2021 when prevalence in Premier League programme was lower than ONS estimates, the trend was generally consistent across both datasets, despite testing being in different populations with very different daily contact patterns.
2. There were re-infections and ‘re-infections’
There were some instances in the dataset of individuals who tested positive, then tested positive again several weeks or months later. However, if we plot the Ct value (i.e. a measure of how much viral shedding is happening, with lower Ct = more shedding), we can see that some of the repeat positives have very high Ct values, and hence are likely to be capturing residual viral fragments from the first infection, rather than a reinfection.
The exception was one individual estimated to be reinfected during the winter 2020–21 Alpha wave, and three individuals reinfected during the mid-2021 Delta wave:
We estimated that the relative risk of getting infected during the Alpha wave, given a previous infection before December 2020, was 0.1 (95% CI: 0.004–0.4). In other words, this suggests a best estimate of around a 90% reduction in risk, which broadly aligns with other work analysing healthcare worker data that estimated a ≈85% reduction in risk from prior infection in 2020.
3. Rapid tests detected virus over a shorter period of time
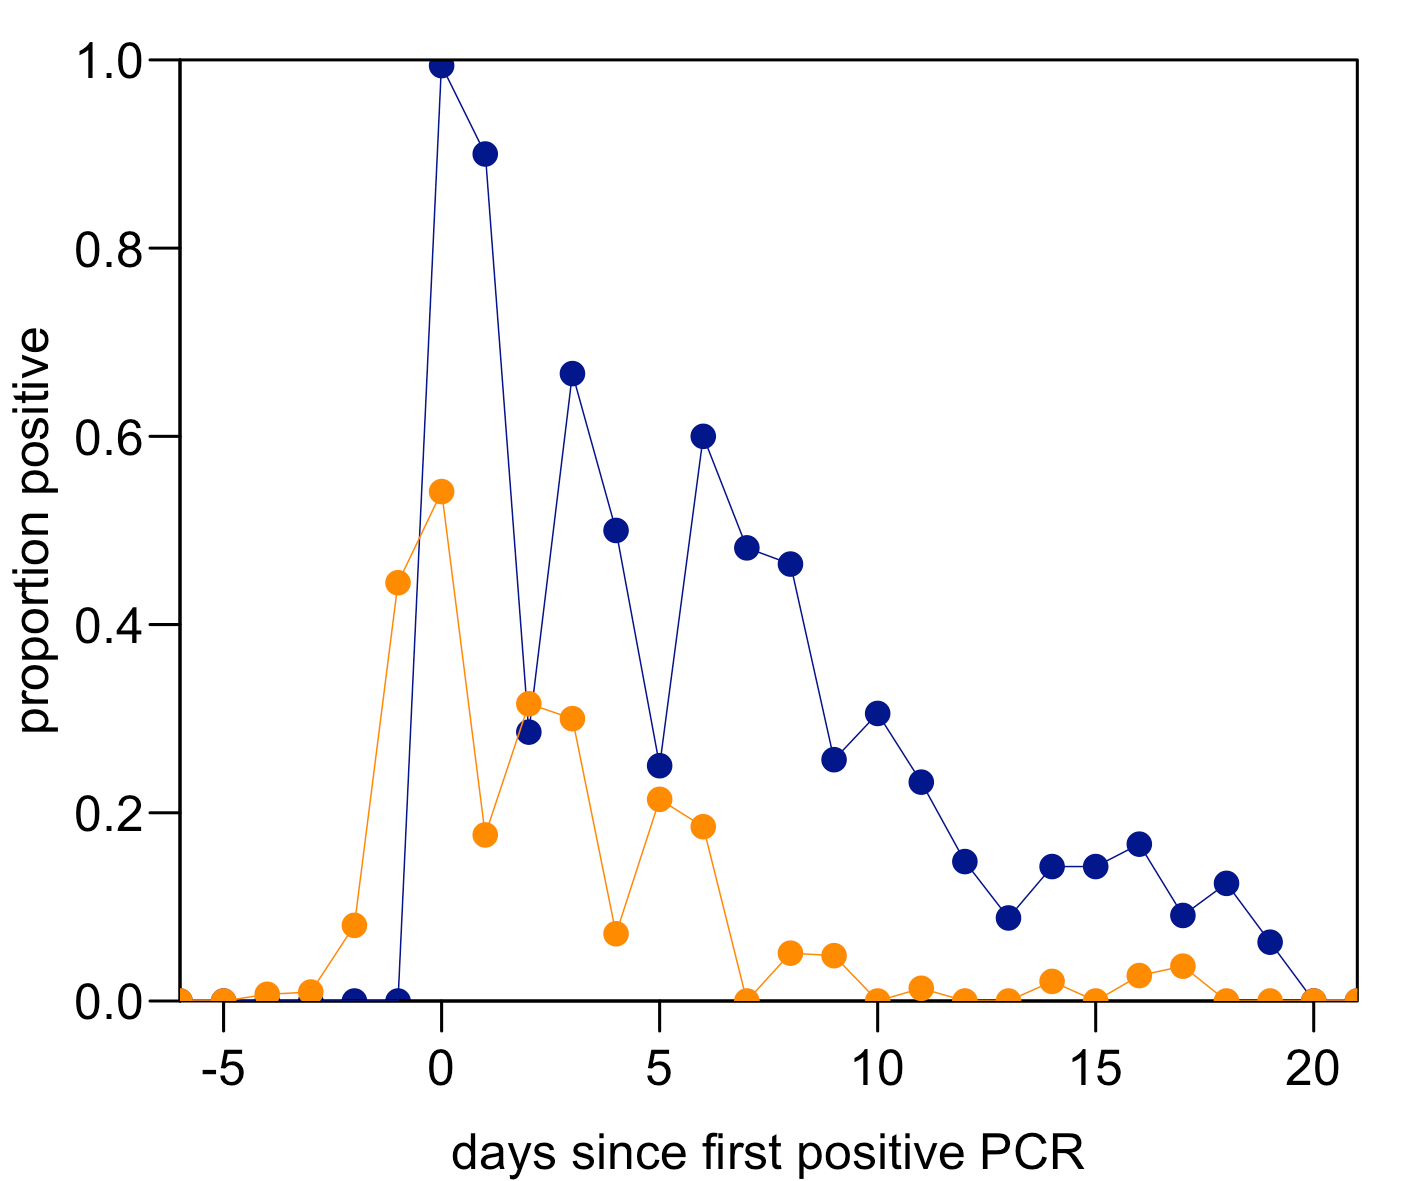
Because both routine PCR and lateral flow testing was conducted during the early Omicron wave in late 2021, it was possible to directly compare the probability of testing positive in each test. The below plot shows the probability of a positive test, by day since their first positive PCR test (note that, by definition, this means 100% of people test positive by PCR at day 0 since their first positive test in our graph). PCR positivity is in blue and rapid test estimates shown in orange:
You can see that rapid test positivity peaks around the same time as PCR positivity. It doesn’t necessarily mean rapid tests can pick up infection before PCR, though, because testing was twice weekly and we’ve aligned the data by first positive PCR (so it’s impossible to have a positive PCR before day 0 in the above plot). But it does show how the dynamics of positivity in rapid tests compare to PCR results in the same individuals.
As I explain in this earlier post, this doesn’t mean the COVID pandemic was a ‘casedemic’ driven by ‘false positives’. Nor does it mean that rapid tests aren’t sensitive enough to be useful:
Sensitivity for COVID testing is traditionally defined in terms of a PCR test. So when people talk about the ‘sensitivity’ of a rapid test, they usually mean how it compares to a PCR test. This might be useful for symptomatic diagnosis, but as noted by many public health researchers, the comparison is less useful if we’re interested in individual infectiousness. If a ‘true positive’ is someone who is infectious, rapid tests will detect a larger proportion of this group than the proportion they would detect if ‘true positive’ is defined as PCR-positive.
Some final thoughts
From healthcare workers and international travellers to workplaces and sports leagues, pandemic testing programmes designed for control provided some valuable insights into the extent of immunity, the characteristics of common tests, and true levels of infection in different countries. Because these programmes were designed primarily for control, they didn’t always include additional measurements – such as genomic sequencing or antibody testing – that would have been scientifically useful but also logistically cumbersome at scale. If you’re interested, this recent piece, written with Oliver Eales and colleagues, has more on the challenges – and constraints – for surveillance of respiratory viruses, particularly outside the acute phase of a pandemic.
But overall, there’s a growing evidence base that measures useful for control during a pandemic – like routine testing to reduce outbreaks in specific populations – can also provide real-time scientific insights into the infection itself. Which can in turn inform more effective control measures in future. The more of these ‘control-then-understanding-then-control’ feedback loops we can identify, and supplement where feasible with additional data collection, the better the position we’ll be in for the next major pandemic threat.
Cover image: Prateek Katyal via Unsplash
For more on analysis of routine travel testing data, see my post from last year:
What did COVID epidemics really look like?
The COVID pandemic was often a story of what was unobserved. How many cases were being missed? Which variants had emerged undetected? What proportion of the population had been infected?


